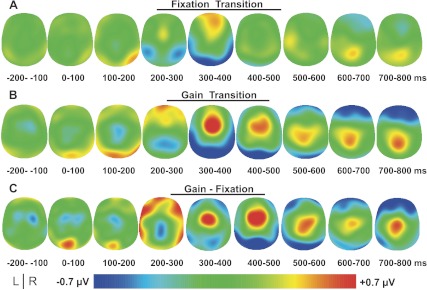
Fig. 6.

Experiment 2: grand-averaged event-related topography in 100 ms time bins from −200 ms to 800 ms after fixation transition (A), gain transition (B), and gain-fixation transitions (C). The potential distribution is projected onto a standardized head shape. L, left; R, right.
