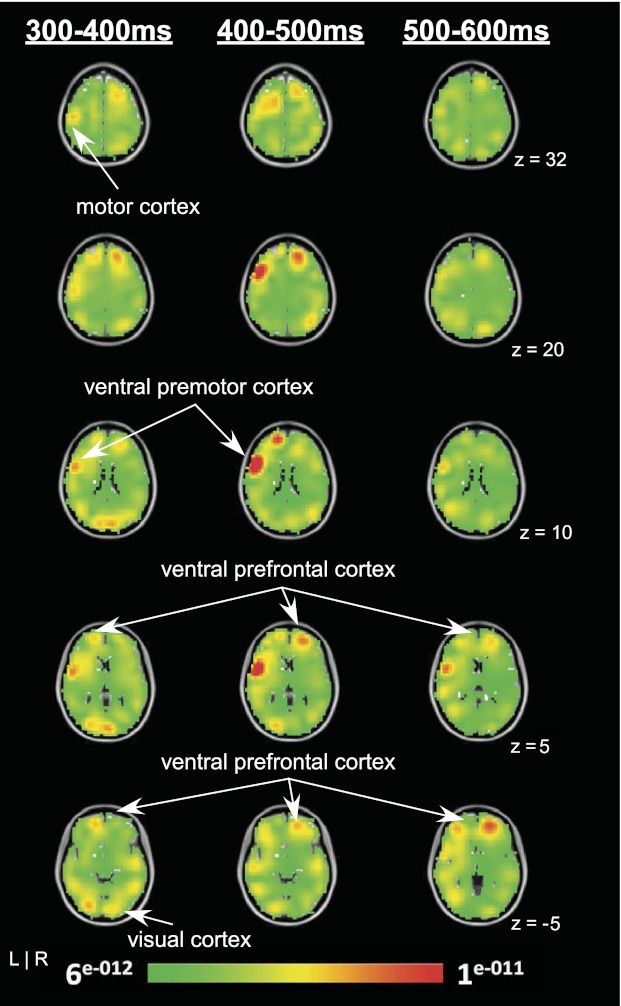
Fig. 8.

Grand-averaged ERP difference results of the LORETA analysis showing current density solutions from 300–400 ms (left), 400–500 ms (middle), and 500–600 ms time bins (right). Each map consists of axial slices showing the unthresholded source activation for each time period. L, left; R, right.
