Figure 3.
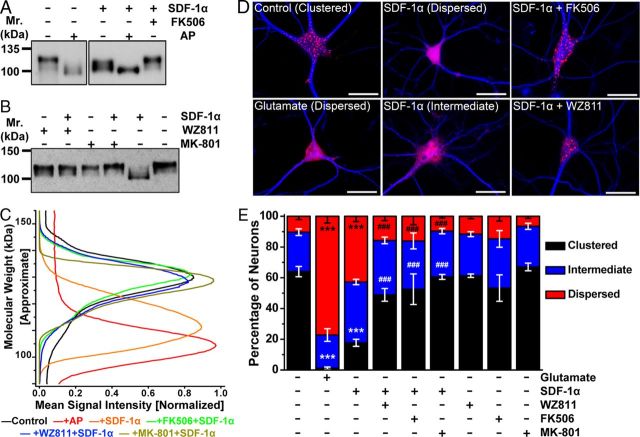
Acute SDF-1α exposure alters Kv2.1 channel phosphorylation and localization in hippocampal neurons. A, Immunoblot analysis of lysates from cultured hippocampal neurons, showing constitutive hyperphosphorylation of Kv2.1 protein (control, ∼125 kDa; AP digestion, ∼97 kDa). Treatment of neurons with SDF-1α (100 nm, 30 min) before lysis led to Kv2.1 dephosphorylation to an intermediate phosphorylated state, which was inhibited by pretreatment with the calcineurin inhibitor FK506 (10 μm). B, Immunoblot analysis of lysates from cultured hippocampal neurons, showing that SDF-1α-induced increase in Kv2.1 mobility was inhibited by pretreatment with the CXCR4 inhibitor WZ811 (100 nm) and the NMDA receptor blocker MK-801 (10 μm). Numbers on the left in A and B denote the approximate molecular weight. C, Quantification of extent of Kv2.1 phosphorylation from immunoblot experiments as shown in A and B, as detailed in Materials and Methods. Traces are presented as mean normalized Kv2.1-immunoreactive band intensities across the shown molecular weight. The higher molecular weight corresponds to phosphorylated and the lower molecular weight corresponds to dephosphorylated Kv2.1 channel protein. Data were calculated from the following independent number of experiments: control (8), +AP (5), +SDF-1α (8), FK506+SDF-1α (4), WZ811+SDF-1α (5), and MK-801+SDF-1α (4). Numbers on the left in A and B denote the approximate molecular weight. D, Representative photomicrographs of cultured hippocampal neurons immunostained with anti-MAP2 (blue) and anti-Kv2.1 (red) antibodies, showing distinct clustered localization of Kv2.1 in the soma and proximal dendrites. SDF-1α treatment (100 nm, 30 min) of neurons led to breakdown and lateral dispersal of Kv2.1 clusters, which was attenuated by pretreatment with WZ811 (100 nm) and FK506 (10 μm). Glutamate (10 μm, 30 min) was used as a positive control for the dispersal of Kv2.1 clusters (Misonou et al., 2004). Scale bars, 25 μm. E, Quantification of the alterations in localization pattern of Kv2.1 during treatment of various drugs, from experiments shown in D, and additionally with the pretreatment of MK-801 (10 μm). Data are presented as mean ± SEM (n = >500 neurons from 4 independent cultures). ***p < 0.001 versus respective patterns in control; ###p < 0.001 versus respective patterns in SDF-1α treatment (one-way ANOVA with post hoc Bonferroni's correction).

