
Figure 5.
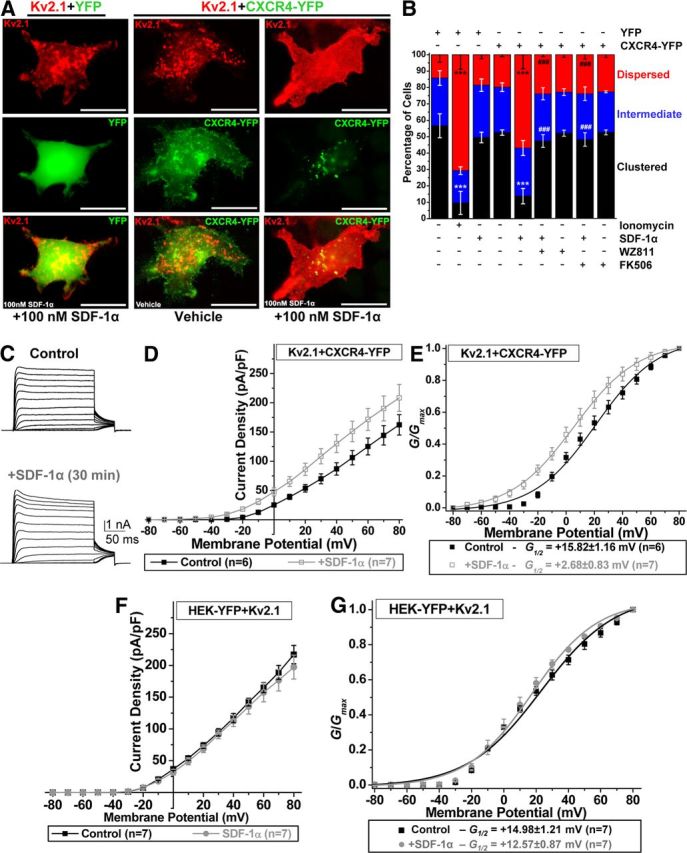
CXCR4 is required for SDF-1α-mediated disruption of Kv2.1 clusters and changes in the voltage dependence of channel activation. A, Representative photomicrographs of HEK293 cells expressing Kv2.1 (red), along with YFP (green; left column) or CXCR4–YFP (green; middle and right columns). Treatment of HEK293 cells expressing YFP with SDF-1α (100 nm, 30 min) does not alter Kv2.1 localization. However, SDF-1α application (100 nm, 30 min) to cells expressing Kv2.1 and CXCR4–YFP causes CXCR4 internalization and lateral diffusion of Kv2.1 clusters. Scale bars, 25 μm. B, Quantification of altered localization patterns of Kv2.1 in HEK293 cells expressing either YFP or CXCR4–YFP (mentioned above the graph) during different drug treatment conditions (mentioned below the graph). SDF-1α-induced (100 nm, 30 min) dispersal of Kv2.1 clusters was attenuated by pretreatment with WZ811 (100 nm) and FK506 (10 μm), indicating that CXCR4-mediated activation of calcineurin is responsible for SDF-1α-induced dispersal of Kv2.1 clusters. Ionomycin-induced (10 μm, 30 min) dispersal of Kv2.1 clusters was used as a positive control, as reported previously (Mohapatra and Trimmer, 2006). Data are presented as mean ± SEM (n = >500 cells from 4 independent experiments). ***p < 0.001 versus respective localization patterns in control; ###p < 0.001 versus respective patterns in SDF-1α treatment group (one-way ANOVA with post hoc Bonferroni's correction). C–E, SDF-1α exposure leads to enhancement in voltage-dependent activation of Kv2.1 channel in HEK293 cells expressing Kv2.1 and CXCR4–YFP. C, Representative traces of Kv2.1 currents from control and SDF-1α (100 nm, 30 min)-treated cells. D, Current density plots of Kv2.1 currents from control and SDF-1α-treated cells, showing increased current density. E, G–V relationship plots showing increased Kv2.1 conductance after SDF-1α treatment. F, G, SDF-1α does not influence Kv2.1 currents in HEK293 cells expressing YFP alone. F, Current density plot of Kv2.1 expressed in HEK293 cells under control and SDF-1α treatment (100 nm, 30 min), showing no change during SDF-1α treatment. G, G–V relationship plots of currents shown in F, showing no change in the voltage-dependent activation of Kv2.1 during SDF-1α treatment (100 nm, 30 min). For D–G, data are presented as mean ± SEM. The G½ potentials of Kv2.1 for control and SDF-1α treatment groups are mentioned in the box below the plot in E and G. For details on voltage-pulse protocols for Kv2.1 current recordings and calculations of current density and G–V plots, see Materials and Methods.