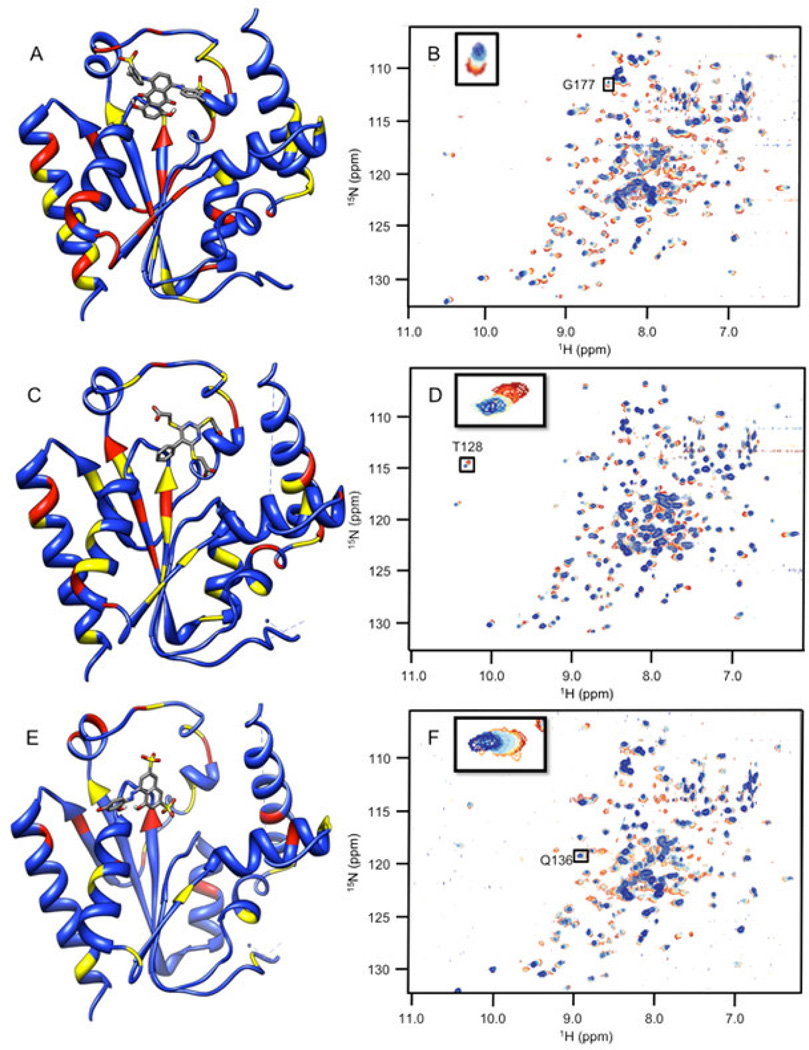
Fig. 2.

Chemical shift perturbations due to binding of the inhibitors identified from the synthetic compound collection. 1H-15N HSQC spectra chemical shifts are mapped onto the human PMK crystal structure [22], with the predicted binding pose from Autodock for each ligand; chemical shift changes are color-coded such that red is a large (> 0.09 ppm) chemical shift change, yellow is a medium (0.05–0.09 ppm) chemical shift change, and blue indicates small or no chemical shift change. Inset panels show chemical shift changes that were used to fit binding data (Eq. 1 and Eq. 2). Panels A and B are for compound CSDDD_1633, C and D are for compound CSDDD_2260, and E and F are for compound CSDDD_2419.
