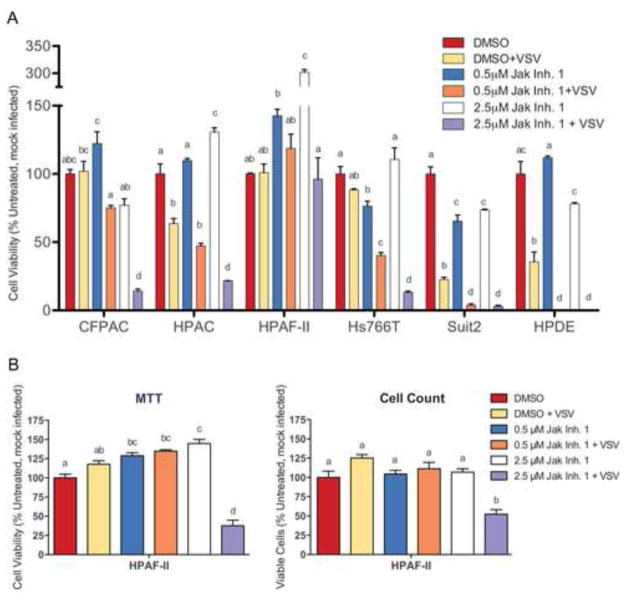
Figure 6. Effect of JAK/STAT signaling inhibition on PDA cell viability following infection.

(A) Cells were mock (DMSO) treated or treated with 0.5 or 2.5μM JAK Inh. I for 48 h prior to infection with VSV-ΔM51-GFP at MOI 1 CIU/cell. Cell viability was analyzed by MTT assay at 5 d p.i. and is expressed as a percent of the DMSO only (mock) control. (B) The same assay was also performed in parallel with viable cell counts. The assays were done in triplicate and data represent the mean ± standard error of mean. Treatments were compared using a 1-way ANOVA followed by the Bonferroni posttest for multiple comparisons. Within each cell line, the presence of the same letter above a bar indicates treatments are not statistically different (cut-off p<0.05). For example, a bar marked “ab” does not differ from one marked “a” or “b” but is significantly different from one marked “c”.
