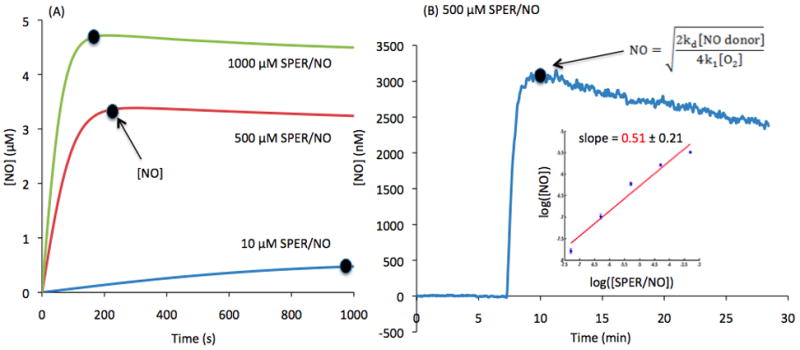
Figure 1.

(A) Predicted continuous release by 1000, 500 and 10 μM SPER/NO. Maximum NO release is indicated by the dot with a constant increase until a pseudo steady-state plateau is reached. (B) NO release from 500 μM SPER/NO over time, detected by an NO electrode (n=4). The dot indicates when maximum [NO] is achieved. (B-Insert) Log-log plot displays the relationship between [NO] and [SPER/NO] using maximum [NO] from ranging [SPER/NO] detected by the electrode. The linear fit of the log-log plot has a slope of 0.508 with a standard deviation of 0.208. The slope is not significantly different than 0.5 (p=0.95).
