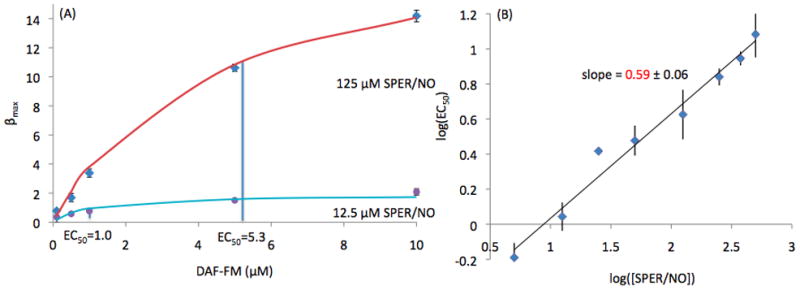
Figure 4.

(A) Data fitting for βmax with respect to [DAF-FM] at 12.5 and 125 μM [SPER/NO] (n=5) indicating EC50 values of 1.0 and 5.3 respectively. (B) Log-log plot of EC50 and [SPER/NO] (n=5) with a linear relationship having a slope of 0.59 and a standard deviation of 0.06. The slope of this line is statistically different than 1 (p<5.5×10⁻⁵) and 0 (p<1.2×10⁻⁵) and close to 0.5.
