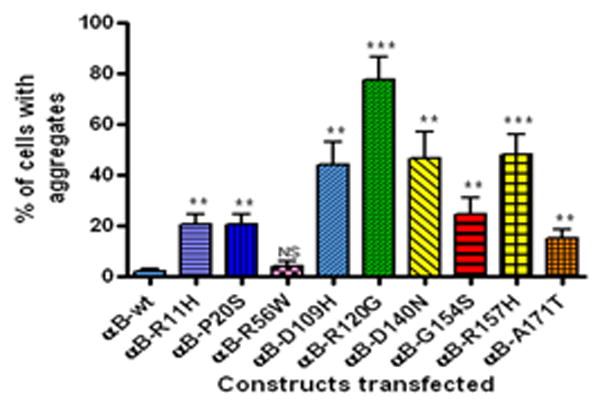
Figure 2.

Percent of cells with aggregates in individually transfected YFP-tagged αB-wt and its mutants: The graph depicts the percent of cells with aggregates after 48 h transfection computed from Fig. 1. The mutants, D109H, R120G, D140N and R157H showed more cells with aggregates. The mutants, R11H, P20S, G154S and A171T showed modest number of cells with aggregates. The p value is * < 0.05; ** < 0.005 and *** < 0.0005 compared to wild-type. NS= not significant.
