
Figure 4.
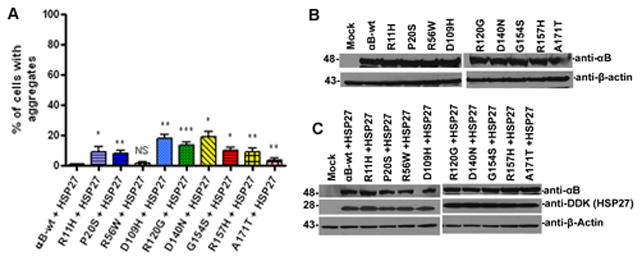
HspB1 co-expression sequestered aggregates. Figure 4A: Percent of cells with aggregates in YFP-tagged αB-wt and its mutants co-expressed with HspB1. The graph depicts the percent of cells with aggregates after 48 h transfection computed from Fig. 3. The p value is * p < 0.05; ** p < 0.005; *** p< 0.0005 compared to mutant alone. NS indicates the value is not significant. Figure 4B: Western blot analysis. Cells were individually transfected with YFP-tagged αB-wt and its mutant constructs. After 48 h transfection, cell lysates were subjected to immunoblot probed with anti-αB-crystallin polyclonal antibody. The actin blot was shown as loading control. Figure 4C: Western blot analyses for cells co-expressed with Myc-DDK-tagged HspB1 in YFP-tagged-αB-wt and its mutant constructs. The blot was probed with polyclonal αB-crystallin antibody (top panel). The same blot was stripped and re-probed with a monoclonal anti-DDK antibody to detect HspB1 (middle panel). The actin blot was shown as loading control (lower panel).