
Figure 7.
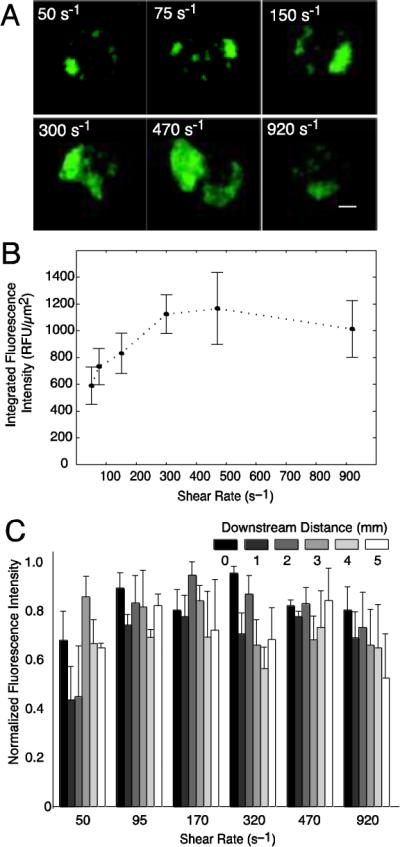
End point analysis of platelet aggregates on 50 μm CTF spots after 5 min perfusions of whole blood through the msMFA. (A) Representative epifluorescence images of platelet aggregates formed over collagen at each shear rate measured. Scale bar = 10 μm. (B) End point integrated fluorescence intensity of platelet aggregates at each shear rate. (C) Normalized fluorescence intensity as a function of downstream distance for each shear rate. A downstream distance of 0 mm refers to the first spot that the flowing blood encounters. Fluorescence intensity was normalized by the maximum intensity for each donor in each channel. Data is the mean of four donors ± SEM.