
Fig. 7.
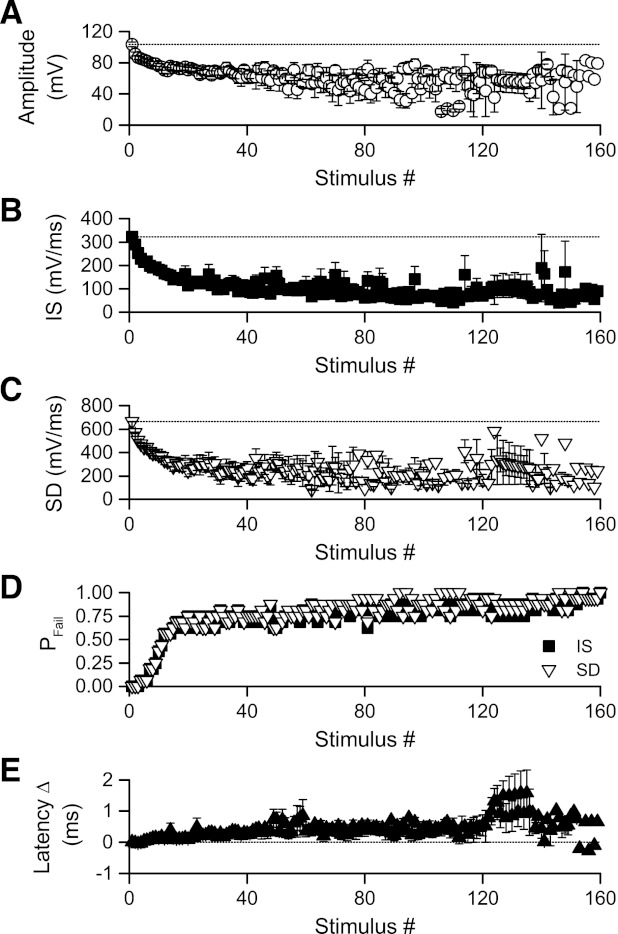
Summary of changes in Schaffer collateral antidromic action potentials during 100-Hz HFS. Antidromic action potentials were recorded during 17 rounds of 1,600-ms, 100-Hz HFS delivered to 12 CA3 pyramidal neurons (5 neurons received 2 trains of HFS). A: mean action potential amplitude plotted against stimulus number during 100-Hz HFS. Amplitude measurements were not included for stimuli that failed to evoke an action potential. Action potential amplitude decreased rapidly at the beginning of HFS, then declined at a slower rate as HFS was continued. B and C: peak dV/dt values for axon IS (B) and SD (C) spike components plotted against stimulus number during 100-Hz HFS. Both components changed equally during HFS, with rapid decreases during the first 200 ms of HFS followed by slower declines as HFS was continued. Measurements were not included for stimuli that failed to evoke an action potential. D: proportion of axon IS and SD failures plotted against stimulus number for all 17 rounds of HFS in 12 cells. For both IS and SD components, the probability of action potential failure increased rapidly during the first 200 ms, then slowly increased as HFS continued. By the end of the 1,600-ms period of HFS, action potentials failed in virtually all recordings. E: on average, antidromic action potential latency was slightly decreased during the first few stimuli, but this change was brief, small, and present in only 2/3 of the cells examined. For each cell, latency increased progressively until action potentials began failing. Measurements were not included for stimuli that failed to evoke an action potential. The increased variability during HFS seen in A–C and E is a consequence of the large increase in action potential failure rate during HFS, and the consequent decrease in the number of cells contributing to the mean values that were plotted.