
Fig. 8.
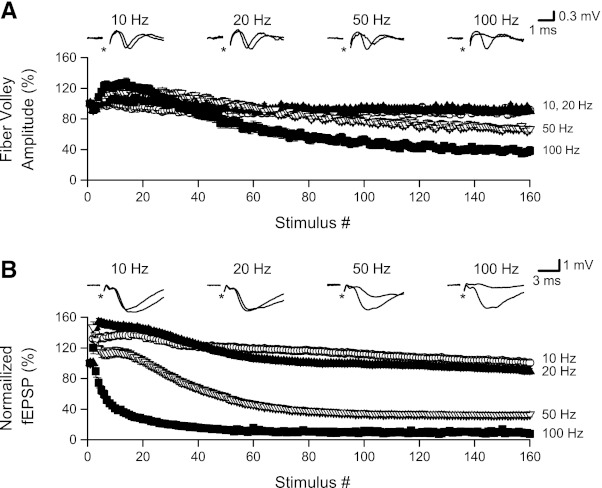
Stimulation at ≥50 Hz caused fiber volley and fEPSP depression. Data shown here are from slices that were given repeated trains of 160 stimuli at 10–100 Hz. A: normalized fiber volley amplitudes plotted against stimulus number during HFS at 10, 20, 50, and 100 Hz. Insets: responses (stimuli 1 and 160) from a representative slice. Although fiber volley latencies increased during HFS at 10 and 20 Hz (see insets), amplitudes were not depressed. Fiber volley amplitudes were depressed by HFS at 50 Hz and were further depressed when HFS was increased to 100 Hz. B: fEPSP slopes plotted against stimulus number during HFS at 10, 20, 50, and 100 Hz. Insets: responses (stimuli 1 and 160) from a representative slice. Although fEPSP latencies appeared to increase slightly during stimulation at 10 and 20 Hz, fEPSP slopes were not depressed during stimulation at these lower frequencies. Increasing stimulation frequency to 50 and 100 Hz caused progressively greater depression of fEPSPs.