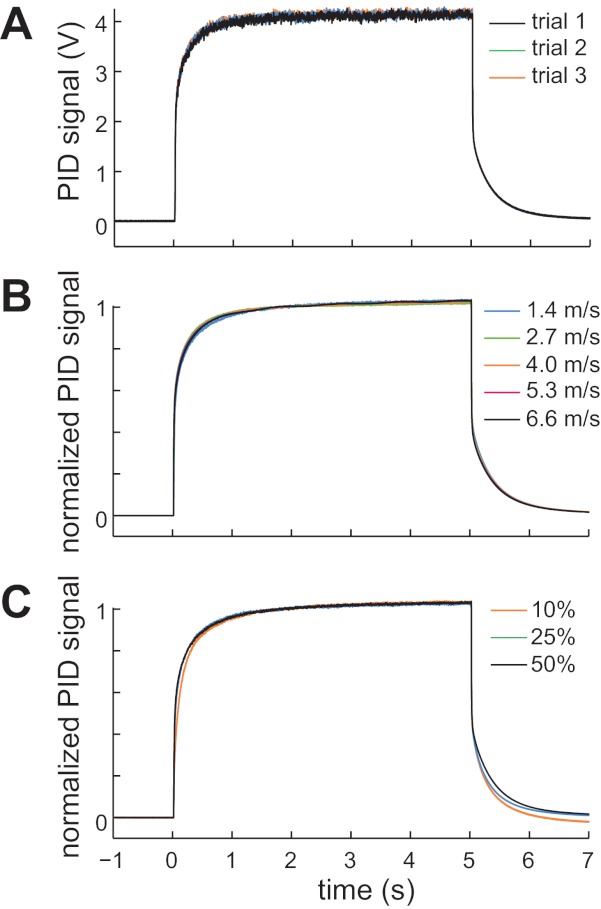
Fig. 4.

Consistency of the odor pulse delivered to the PID. A: consistent raw PID voltages elicited by 3 successive stimulus presentations (10% linalool oxide at an air speed of 2.7 m/s). B: consistent dynamics of normalized PID responses to the same odor at different air speeds (10% linalool oxide; n = 11). C: consistent dynamics of normalized PID responses to the same odor at different concentrations (linalool oxide at an air speed of 2.7 m/s; n = 11). Traces in B and C were normalized to their maximum value and then averaged across all trials and experiments. Note that ORN firing rates in Figs. 5–8 were measured over the time window from 0 to 5 s.
