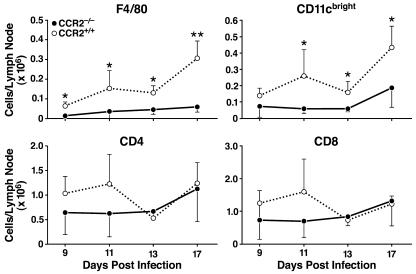
Figure 4.
MLN leukocyte analysis after infection with M. tuberculosis. Leukocytes from MLNs were isolated from CCR2−/− and CCR2+/+ mice and analyzed by flow cytometry on days 9, 11, 13, and 17 after infection. The cells were stained with fluorescent antibodies to F4/80 (macrophages), CD11c (bright; DCs), CD4, and CD8. Shown are the mean cell numbers for each cell type for four to six CCR2−/− and CCR2+/+ mice on each day. Error bars represent the standard deviation from the mean (*, P ≤ 0.05; **, P ≤ 0.01). Analysis of another macrophage marker (CD11b+Gr-1−) yielded results similar to those obtained with F4/80 (data not shown).

