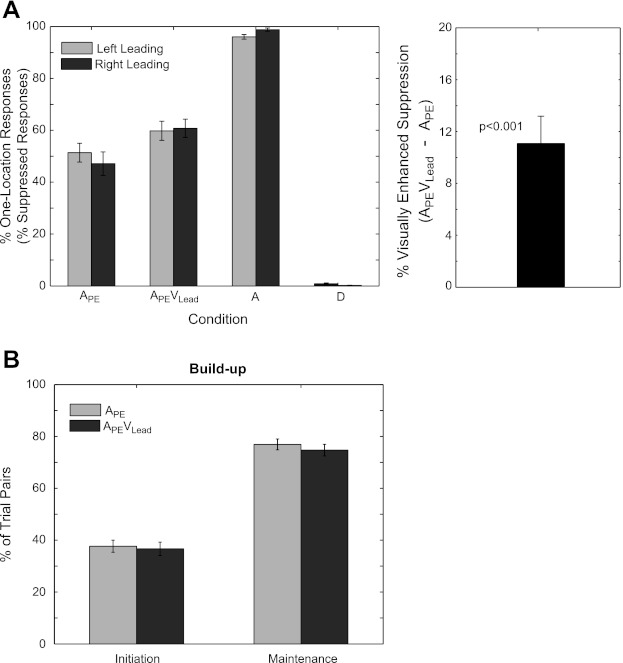
Fig. 3.

Subject behavior during the EEG experiment. A: the percentage of one-location (Suppressed) responses (left) and the percentage increase in Suppressed responses in condition APEVLead compared with APE (right) are plotted for each condition separately for left-leading and right-leading groups. The reader will recall that the percentage of one-location responses and the percentage of Suppressed responses are synonymous, only in the APE and APEVLead conditions. The addition of a contemporaneous visual cue at the location of the leading sound (i.e., condition APEVLead) led to a 11.02 ± 2.10% (P < 0.001) enhancement of echo suppression. B: 2 metrics for buildup, Initiation and Maintenance, are reported for conditions APE and APEVLead. Initiation reflects the percentage of APE/APEVLead trials eliciting a “Suppressed response” following a “Not-Suppressed response” in an immediately preceding APE (light gray) or APEVLead (dark gray) trial. In contrast, Maintenance reflects the percentage of APE/APEVLead trials eliciting a “Suppressed response” following a “Suppressed response” on an immediately preceding APE (light gray) or APEVLead (dark gray) trial. Intuitively, Initiation provides a measure for how quickly subjects establish a set of listening expectations, while Maintenance reflects how likely an established set of expectations are to persist over trials. There were no significant differences of either buildup metric between conditions, suggesting that vision does not contribute directly to listener expectations in the context of “buildup.” N = 21 (11 left-leading, 10 right-leading). Error bars reflect SE.
