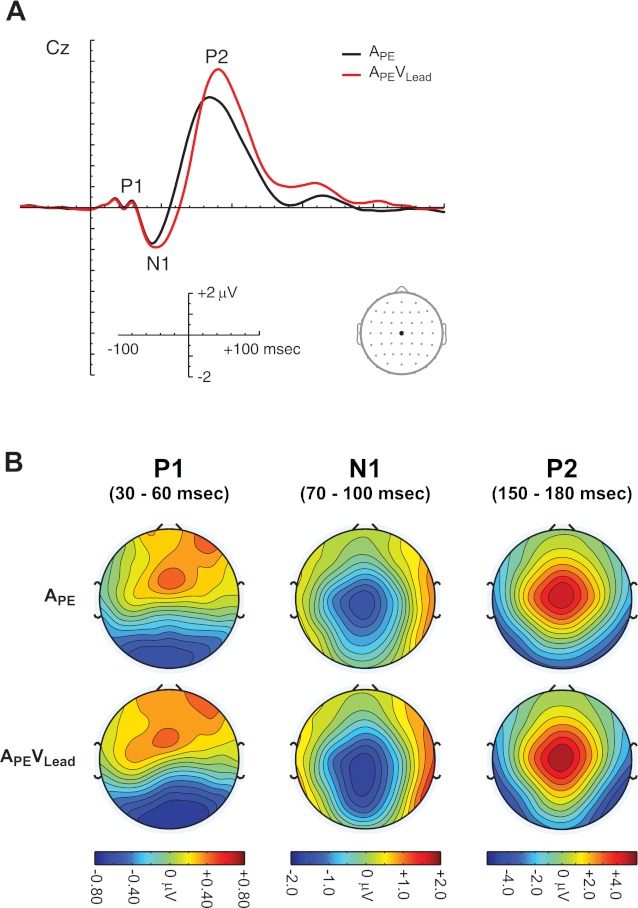
Fig. 4.

ERPs to lead-lag auditory pairs. A: grand average ERPs for conditions APE and APEVLead are plotted at electrode Cz. ERPs comprise the auditory P1, N1, and P2. B: scalp topographies during the auditory P1 (30–60 ms), N1 (70–100 ms), and P2 (150–180 ms) are plotted for conditions APE and APEVLead. Please note that, although the APE and APEVLead topographies are qualitatively similar, the APEVLead ERP and topographies comprise responses to both auditory and visual stimuli.
