Fig. 8.

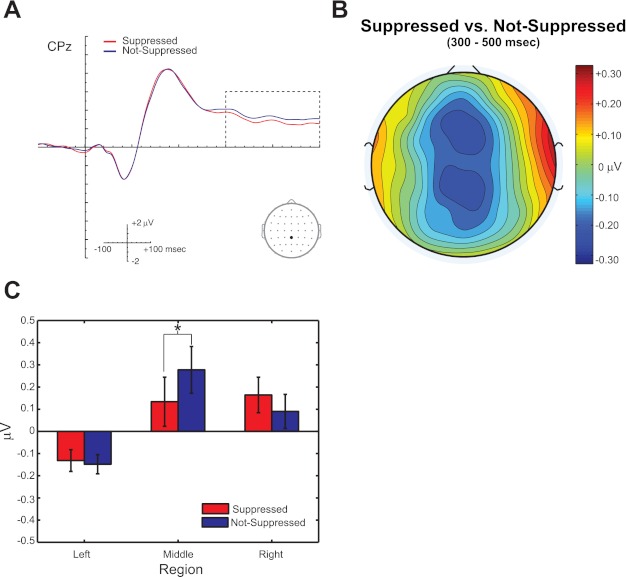
Perception is reliably indexed from 300 to 500 ms. A: Suppressed and Not-Suppressed ERPs, collapsed over conditions APE and APEVLead, plotted at electrode CPz. B: topographical difference map for the Suppressed vs. Not-Suppressed comparison. C: mean amplitude from left, middle, and right sections. Analyses reveal that echo suppression is reflected as a negativity over middle electrode sites from 300 to 500 ms (*P < 0.05). N = 21. Error bars reflect SE.
