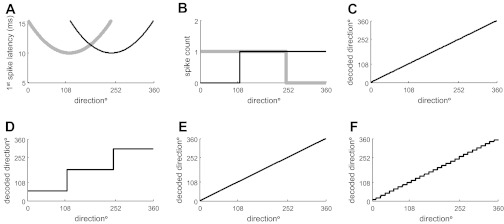
Fig. 6.

Decoding 1st-spike latency and spike count population codes: hypothetical illustration. A: latency response as a function of stimulus direction (tuning curve) for 2 hypothetical neurons with different preferred directions. B: spike count as a function of stimulus direction for the same neurons. C: actual vs. decoded stimulus direction based on the population latency code of A. D: actual vs. decoded stimulus direction for the spike-count code of B. E and F: corresponding decoding results for a population of 30 hypothetical neurons with identical tuning curve shape to those illustrated in A and B and preferred directions evenly distributed in the range 0–360°.
