
Fig. 7.
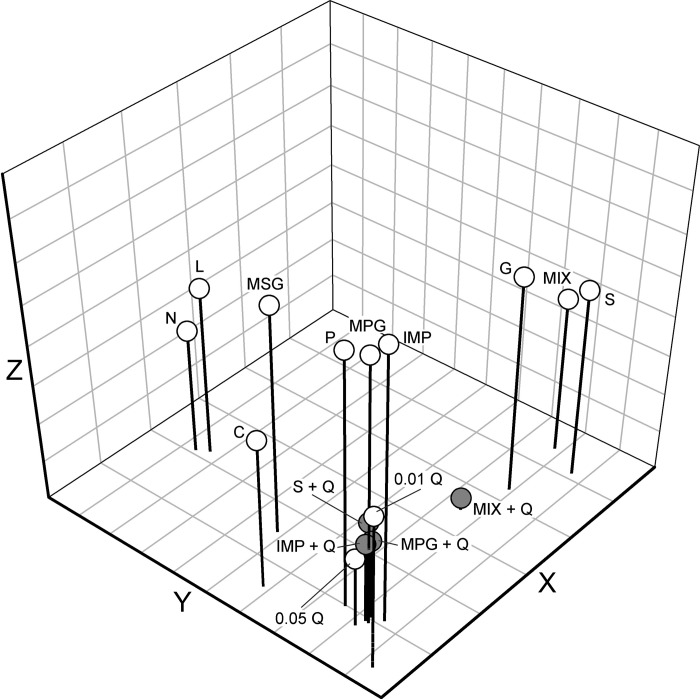
Distribution of 14 taste stimuli in a 3-dimensional taste space resulting from multidimensional scaling. Stress values were 0.16405 for 1 dimension, 0.07809 for 2 dimensions, 0.01161 for 3 dimensions, 0.00122 for 4 dimensions, and 0.00022 for 5 dimensions. S, sucrose; N, NaCl; C, citric acid; Q, QHCl; G, glucose; L, LiCl; P, Polycose; MIX, MPG+IMP. Shaded circles indicate mixtures with QHCl.