Fig. 1.

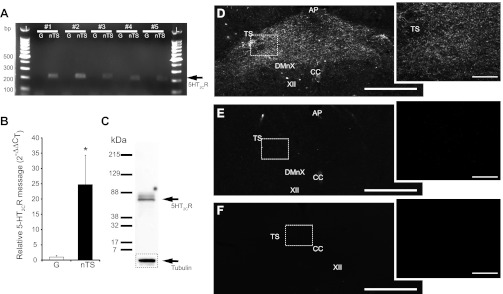
5-HT2C receptor (5-HT2CR) message and protein is expressed in nucleus tractus solitarii (nTS). A: agarose gel image from 5 of 6 individual rats illustrating 5-HT2CR cDNA (arrow, 206 bp) in nTS and nodose-petrosal ganglia (NPG, denoted as G) tissue. Note the greater expression of 5-HT2CR in nTS compared with NPG. L, 100-bp ladder. B: relative expression of 5-HT2CR cDNA in nTS compared with NPG, as determined by the 2−ΔΔCT method (where CT is threshold cycle). Note the increase in relative nTS expression compared with NPG (*P < 0.05). n = 6, 5 of which are shown in A. C: immunoblot analysis of whole brain stem tissue (40 μg) using the 5-HT2CR antibody. The presence of a single band at ∼52 kDa suggests specificity of the antibody used in immunohistochemistry. The loading control marker, tubulin, is shown below. D: light photomicrograph of the caudal (medial and commissural) nTS. Note the robust 5-HT2CR staining in the caudal nTS. E: preincubation of anti-5-HT2CR with 5-HT2CR recombinant protein results in diminished positive immunoreactivity compared with nonpeptide (D)-incubated tissue. F: nonprimary antibody control tissue incubated with secondary antibody alone. Note that staining is similar between E and F. D–F, right: zoomed photomicrograph (×20 objective, confocal) of boxed area on ×4 objective photomicrograph, left. Scale bars, 250 μm (left) and 100 μm (right). TS, solitary tract; DMnX, dorsal motor nucleus of the vagus; AP, area postrema; CC, central canal; XII, hypoglossal nucleus.
