Fig. 2.

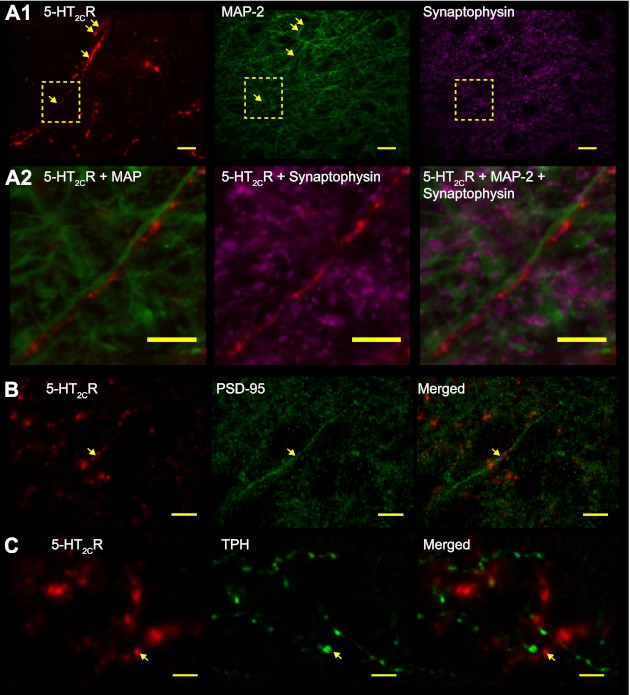
5-HT2CR localization in the nTS. A1: confocal images of immunoreactivity (IR) for 5-HT2CR (pseudocolored red, left), microtubule-associated protein-2 (MAP-2; pseudocolored green, center), and synaptophysin (pseudocolored magenta, right). Dashed box in A1 is enlarged in A2. Arrows depict 5-HT2CR-IR in close apposition to MAP-2. Note the 5-HT2CR fibers in nTS that run in parallel with MAP-2 dendrites. Shown is a z-projection image of 5 images separated by 0.2 μm. A2: merged photomicrographs of IR in A1 boxed area for 5-HT2CR with MAP-2 (left) and synaptophysin (center) and merge of all markers (right). Shown is an z-projection image of 3 images separated by 0.2 μm. Note that 5-HT2CR coincides with MAP-2 in long fibers, with synaptophysin apposed to this complex. B: 5-HT2CR (red) colabeling with postsynaptic density-95 (PSD-95; green, arrow). C: 5-HT2CR (red, arrow) did not colabel with tryptophan hydroxylase (TPH; green). In B and C, merged images are shown on right for each marker. Scale bars, 10 μm
