
Fig. 10.
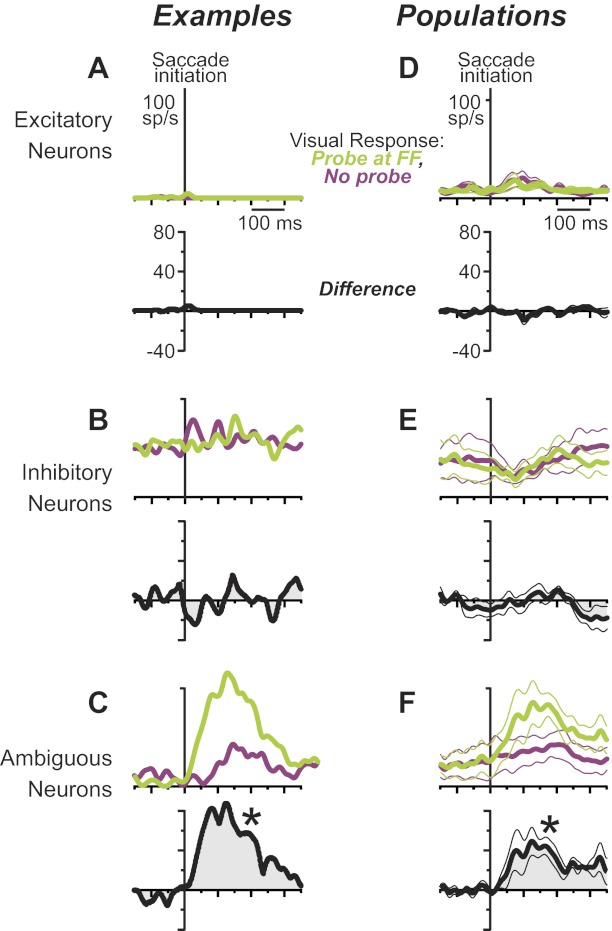
Remapped visual responses of the layer IV classes, aligned to saccade initiation. All data show visual responses to probes presented at the FF just before the saccade (green) compared with time-matched activity in no-probe trials (purple). Black traces show differences of the green and purple data (green − purple); a significant difference (*P < 0.05) defines remapping. An example putative excitatory (A) and inhibitory (B) neuron showed no remapping, but (C) an example ambiguous neuron did (these are the same neurons as shown in Fig. 8). Population data showed the same result: no remapping for (D) putative excitatory or (E) inhibitory neurons but significant remapping for (F) ambiguous neurons.