
Fig. 4.
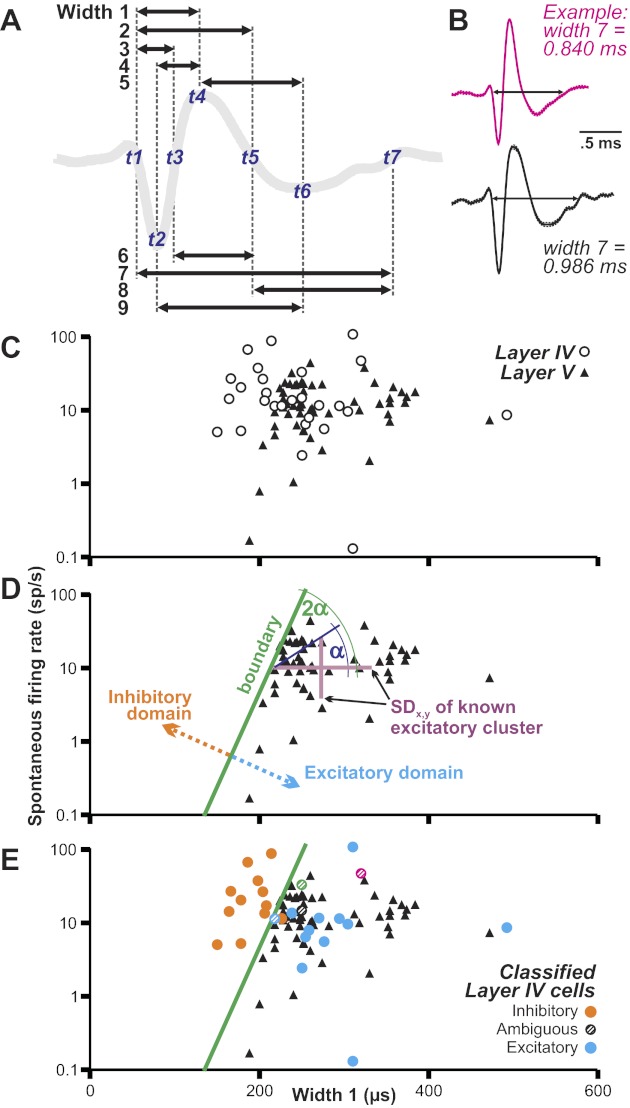
Categorization method for identifying putative neuron types in FEF layer IV. A: we measured 9 widths of each action potential (arrows), based on 7 time points (t1–t7). B: example of 1 width measure (action potential start to end; width 7) for (top) the layer IV neuron of Fig. 3B and (bottom) the layer V neuron of Fig. 3C. Each waveform is the mean (bold curve) ± SE (dashed curves, barely visible) of all action potentials collected from the neurons. C: plot of width vs. log10(spontaneous firing rate) for the layer IV and V neurons. A swath of layer IV neurons stands out clearly, at the upper left, from the layer V (known excitatory neurons) cluster. The layer IV neurons overlap partially with the calibration cluster of known pyramidals (black triangles). Data are shown for width 1 measurement. D: geometrical construction of an objective boundary at the upper-left edge of the layer V cluster to create putative inhibitory (orange) and excitatory (blue) domains for classifying layer IV neurons according to width 1. SDx,y, SDs of the layer V cluster in the x and y directions (purple lines). We drew the hypotenuse between these SDs as plotted on the graph (dark blue line), found its angle relative to the x-axis (α), doubled it (2α), and translated the resulting line to the upper-left edge of the cluster (green line). E: layer IV neurons (circles) overlaid onto the same layer V cluster and its boundary. Colors and patterns of the circles depict the final classification of each neuron, based on analysis of all of the width measures (see Fig. 6A). The 4 ambiguous neurons have different colors so that they can be tracked across graphs.