
Fig. 7.
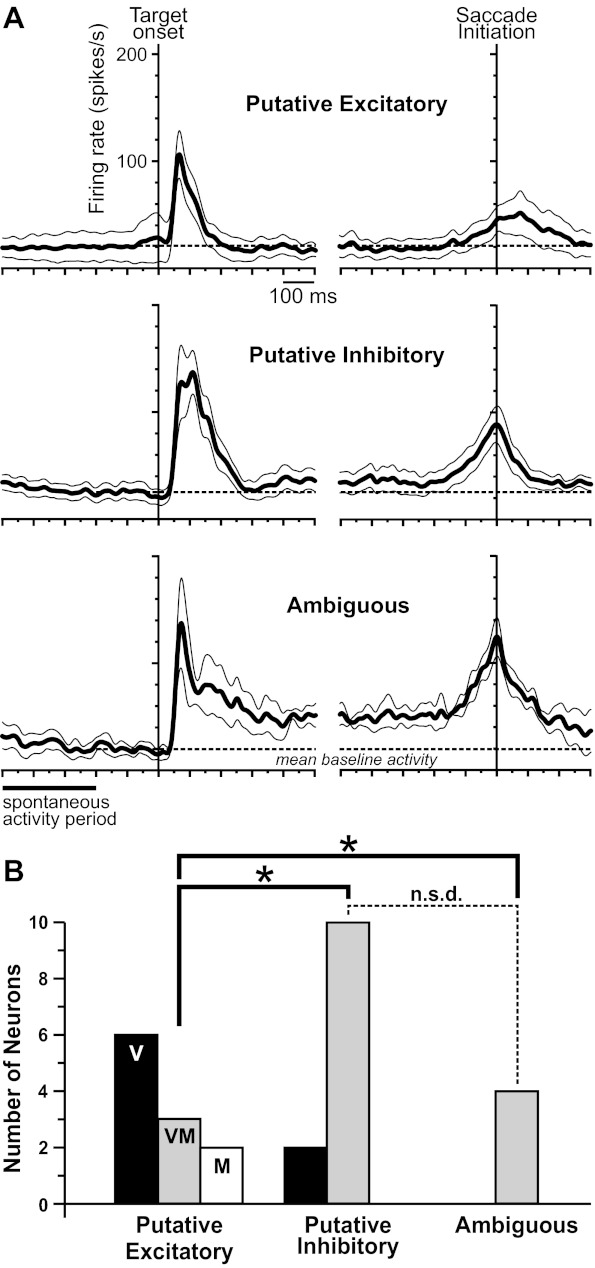
Activity profiles of the layer IV neuronal classes during memory-guided saccades. A: average spike-density functions (±SEs) of the 11 putative excitatory (top), 12 putative inhibitory (middle), and 4 ambiguous neurons (bottom). Activity profiles were aligned to visual target onset (left) and saccade initiation (right). Gaussian of each spike-density function was width 10 ms, here and in the remaining figures. We used the mean activity 200–0 ms before target onset as the baseline level (dashed lines) for evaluating later activity. B: composition of each class in terms of visual (V), visuomovement (VM), and movement (M) neurons. n.s.d., not significantly different; *P < 0.05.