
Fig. 8.
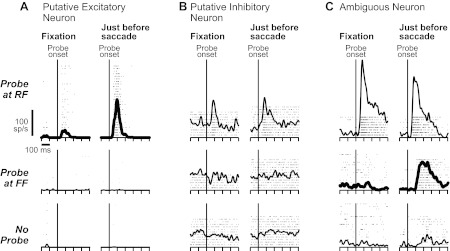
Activity of layer IV example neurons during the remapping task. A–C: in each panel, the rows show the probe condition: located at the RF (top), the FF (middle), or not presented (bottom). The columns show the probe timing: presented during initial fixation (left) or just before the saccade (right). Activity changes that represent components of remapping are emphasized with bold spike-density functions. A: example putative excitatory neuron. Its visual response increased at the RF just before the saccade. It was unresponsive at the FF and in the absence of a probe. B: example putative inhibitory neuron. Its visual responses were unchanged before the saccade. C: example ambiguous neuron. It showed an emergent visual response at the FF just before the saccade but little if any change in activity at the RF or in the absence of a probe.