
Fig. 9.
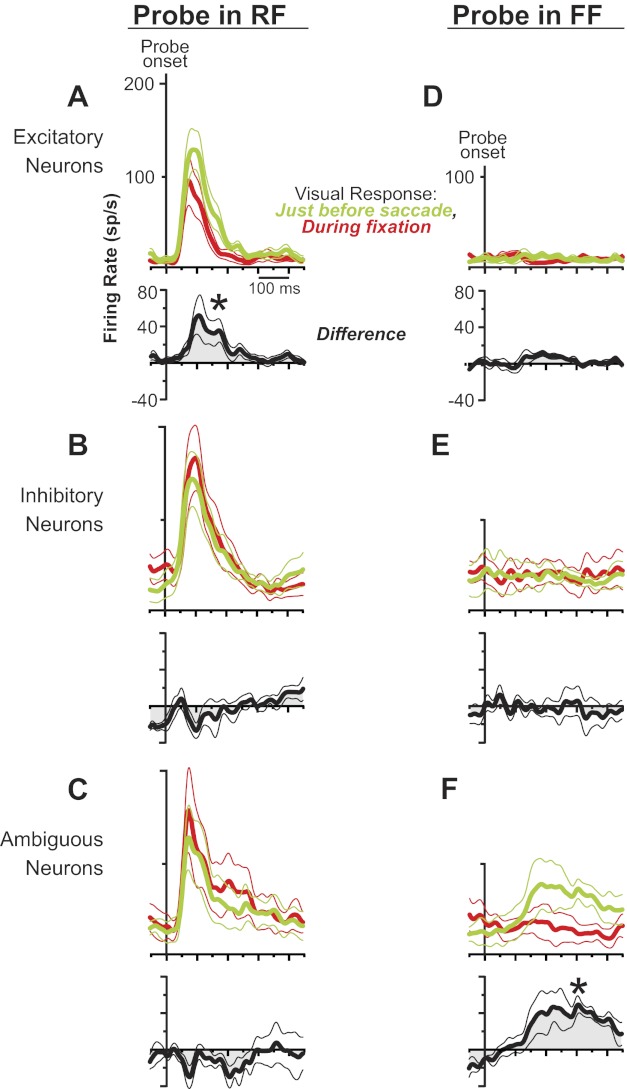
Population data for the layer IV neuronal classes during the remapping task. Data show average activity profiles (±SEs) aligned to probe onset. Black traces show differences of red and green data (green − red); *P < 0.05. When probes were presented at the RF, (A) putative excitatory neurons increased their visual response significantly just before the saccade (green) compared with during fixation (red); (B) putative inhibitory neurons and (C) ambiguous neurons showed no change. When probes were presented at the FF, (D) putative excitatory and (E) inhibitory neurons showed no change in activity just before the saccade, but (F) ambiguous neurons increased their activity significantly.