Figure 2.

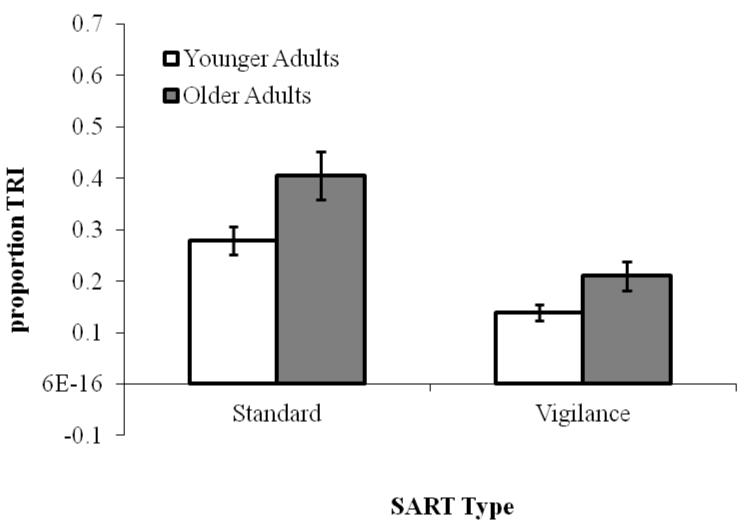
Mean proportion of TRI reports, by SART Type (Standard, Vigilance) and Age (Younger and Older adults) in Experiment 1. Error bars represent standard errors. Note: TRI = task-related interference.

Mean proportion of TRI reports, by SART Type (Standard, Vigilance) and Age (Younger and Older adults) in Experiment 1. Error bars represent standard errors. Note: TRI = task-related interference.