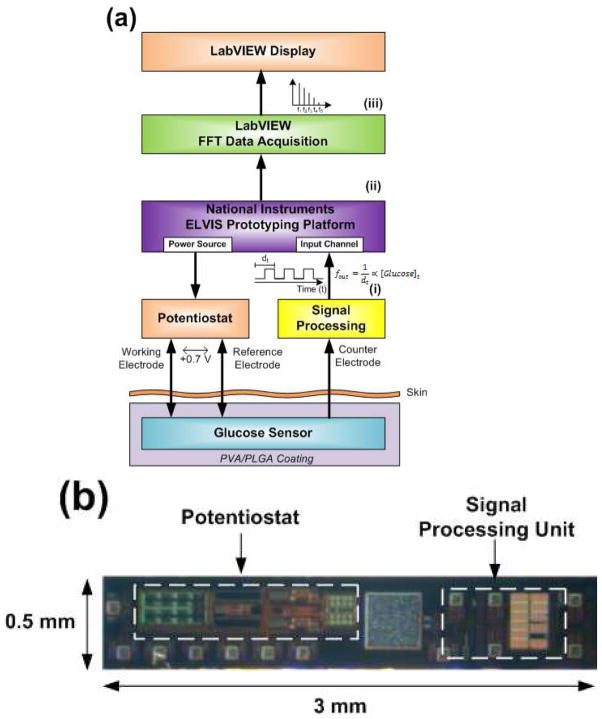
Fig. 2.

(a) Block diagram of the in vitro and in vivo transcutaneous sensor system under investigation. The CMOS potentiostat and signal processing unit interface with the electrochemical glucose sensor to produce a frequency in the form of square pulses (i). This frequency is then sent to the National Instruments ELVIS Prototyping Platform (ii) where and the resulting data are gathered and processed via the fast-fourier transform (FFT) algorithm (iii) to extract the frequency with the maximum amplitude (i.e. f1) and graphically display it on a computer interface using LabVIEW software. (b) Photograph of the CMOS fabricated potentiostat and signal processing unit.
