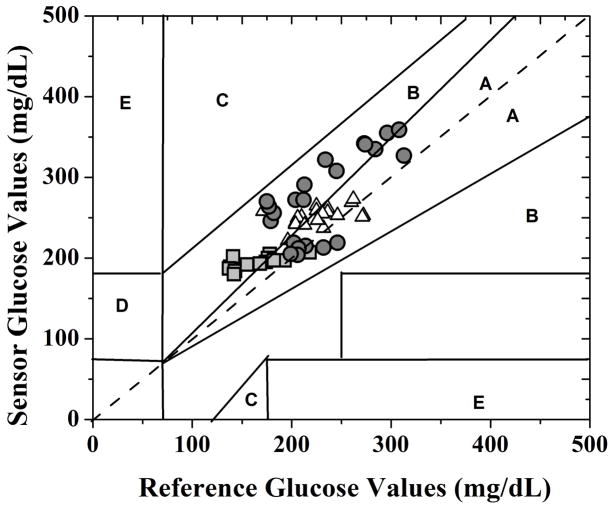
Fig. 6.

Clarke’s error grid analysis of the blood glucose values as-obtained from the transcutaneous glucose sensor of Figure 1 (after retrospectively accounting for the lag phase between the blood and subcutaneous glycemic events) shown in Figure 5 when interfaced with the MOSIS-fabricated potentiostat and signal processing block versus tail vein reference glucose values. The three different symbols (square, circle and triangle) corresponds to the three rats evaluated in vivo.
