
Figure 7.
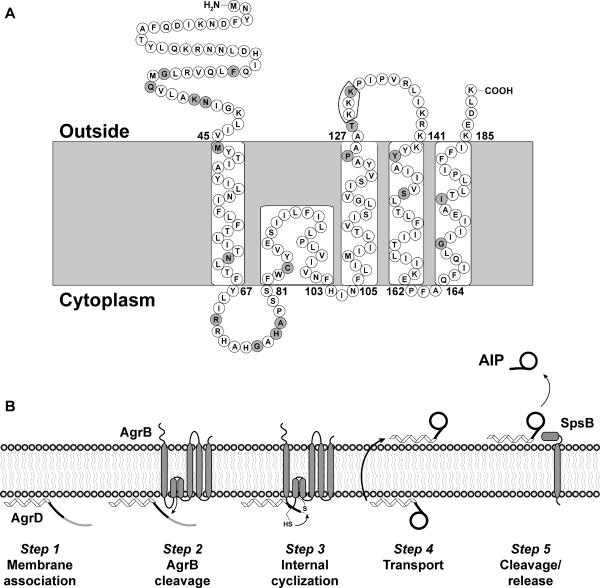
SCAM predicted membrane topology of AgrB and revised AIP biosynthesis model. Panel A, the topology model is based on interpretation of the SCAM assay results shown in Figures 5 and 6. Sites of mutations that decreased AIP production are shaded gray. Residues K129–K131, which disrupted a later step in AgrD processing, are boxed. Panel B, a model for AIP biosynthesis was previously reported (Thoendel & Horswill, 2009), and this model has been revised using the new AgrB topology assignments.