
Figure 4. Analysis of purified DT-TGF.
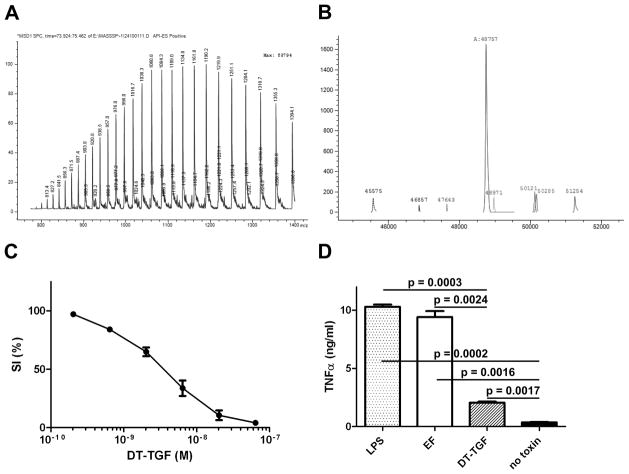
(A and B) Electron spray ionization mass spectrometry analysis of DT-TGF. (A) Mass spectrum for DT-TGF (m/z ratio on x axis and relative abundance on x axis). (B) Deconvolution of the data in A to obtain intact mass of DT-TGF. (C) Cytotoxicity of DT-TGF on HN6 human head and neck cancer cells. HN6 cells (10,000/well) were exposed to different concentrations of DT-TGF for 48 h and viable cells were quantitated in an MTT assay. Relative survival was calculated as the percentage of living cells after treatment in relation to untreated cells. Error bars indicate S.E.M. of two independent experiments performed in triplicate. (D) TNF-α release assay. 1 × 10⁶ RAW264.7 cells were grown overnight and incubated with 10 μg/mL DT-TGF or anthrax toxin edema factor (EF, purified from E. coli) or 10 pg/mL LPS for 18 h at 37 °C. TNF-α in the supernatants was quantitated by TNF-α ELISA.