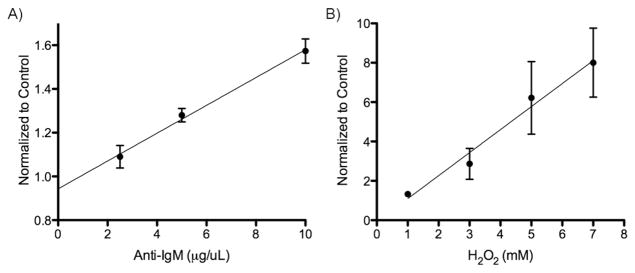
Figure 3.

Detection of stimulant dose-dependent intracellular Syk activity. (A) DG75 cells were treated with the SAStide biosensor (25 μM) 15 min prior to stimulation. The cells were stimulated with varying concentrations of anti-IgM (A) or varying concentrations of H2O2 (B). Cells were harvested 5 min following stimulation and the amount of phosphorylated biosensor was measured. Experiments were performed in triplicate and the data are reported as fold change compared to the unstimulated control (which exhibited levels of signal similar to background observed in the in vitro assay shown in Fig. 2, ~4000–8000 RFU). Data points represent the average of three measurements and error bars indicate the standard error of the mean.
