
Figure 5.
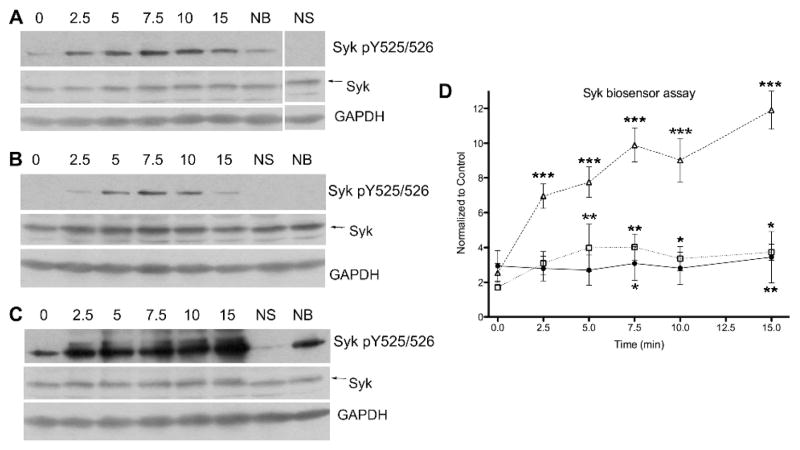
Detection of time-dependent Syk activity following cell stimulation. DG75 B cells were treated with the SAStide biosensor (25 μM) 15 min prior to stimulation. The cells were stimulated with anti-IgM (5 μg/mL) (panel A and closed circles in panel D), H2O2 (3 mM) (panel B and open squares in panel D) or both (5 μg/mL anti-IgM and 3 mM H2O2) (panel C and open triangles in panel D). (A–C), the expression of Syk, Syk phosphorylated on Y525 and Y526 (Syk pY525/526) and GAPDH (loading control) in cell lysates were analyzed by Western blotting. NS - no stimulation; NB - no biosensor (15 min harvest). (D), cells were harvested at varying time points following stimulation and analyzed for biosensor phosphorylation. Experiments were performed in triplicate. Data are reported as normalized change compared to the unstimulated control; error bars are shown either above or below data points for clarity. Data were analyzed using a repeat measure one-way ANOVA test and a Dunnet post-test. Statistical significance is indicated as follows: *P<0.05, **P<0.01 and ***P<0.001.