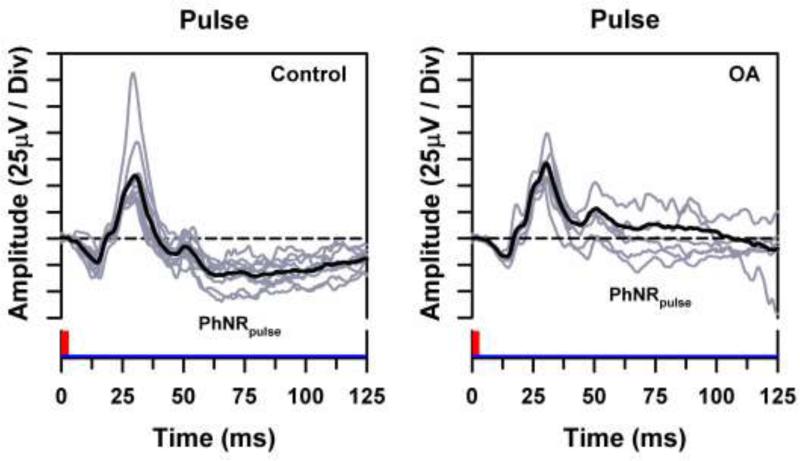
Fig. 1.

Individual ERG waveforms (gray traces) and overall mean ERG waveform (black traces) for the control subjects (left) and OA patients (right) in response to a long-wavelength luminance pulse presented against a short-wavelength adapting field, with the stimuli represented along the x-axes. Horizontal dashed lines represent the baseline from which the PhNRpulse was measured.
