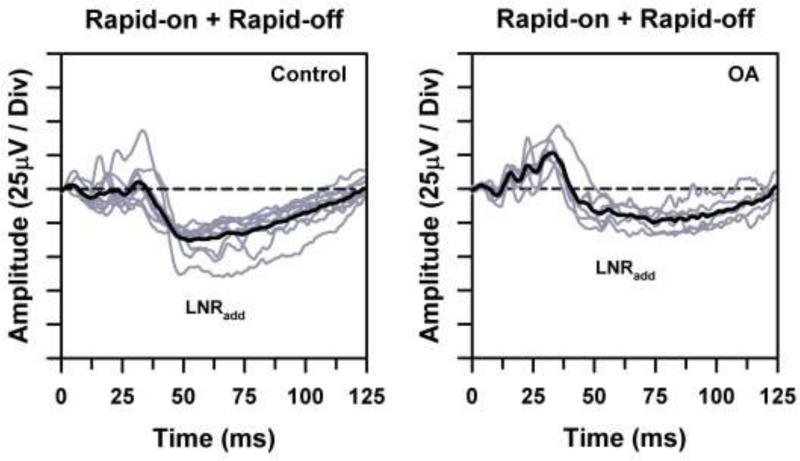
Fig. 3.

Individual ERG waveforms (gray traces) and overall mean ERG waveform (black traces) for the control subjects (left) and OA patients (right), obtained by summing the ERG waveforms obtained in response to the rapid-on and rapid-off sawtooth flicker shown in Fig. 2. Horizontal dashed lines represent the baseline from which the LNR was measured.
