
Fig. 5.
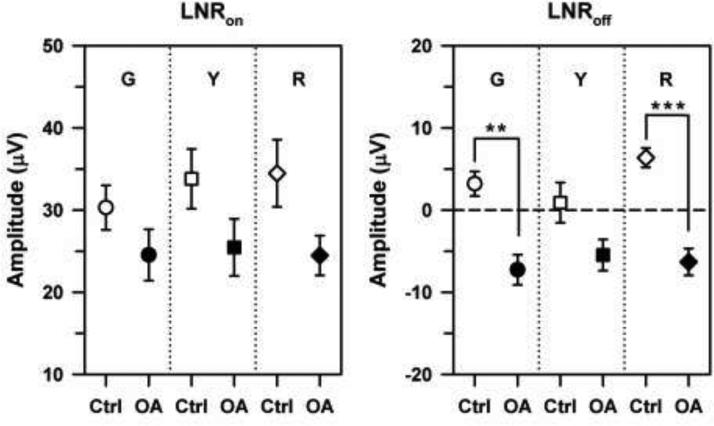
Mean LNRon (left) and LNRoff (right) amplitudes of the control subjects (open symbols) and OA patients (filled symbols) in response to G (circles), Y (squares), and R (diamonds) sawtooth flicker that was either rapid-on (left) or rapid-off (right). The horizontal dashed line demarcates zero amplitude; negative amplitudes indicate a response above the baseline. Error bars represent ±1 sem. Brackets and asterisks indicate statistically significant comparisons, where ** indicates p < 0.01 and *** indicates p < 0.001.