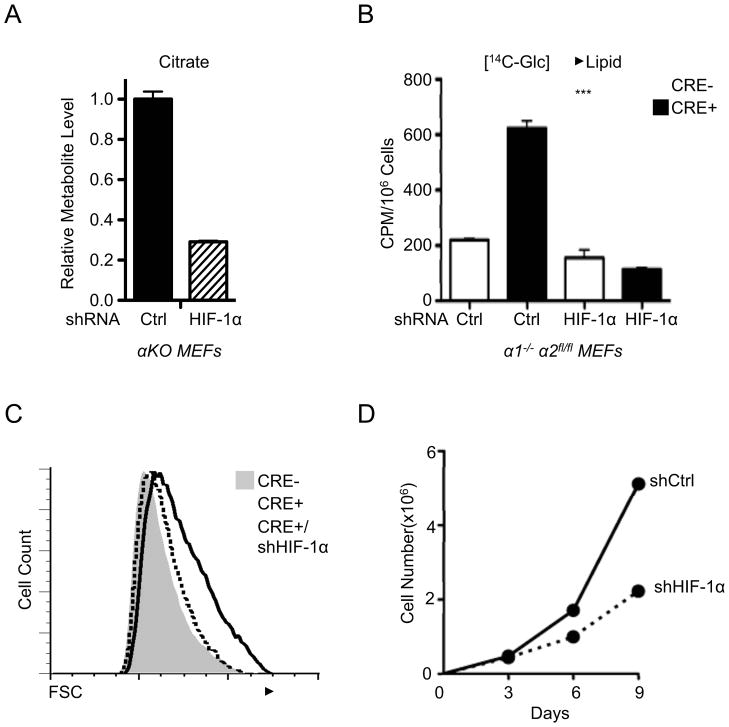
Figure 6. HIF-1α drives increased biosynthesis and proliferation of AMPKα-null cells.

A) Relative citrate abundance in metabolite extracts from AMPKα-deficient (αKO) MEFs expressing control (Ctrl) or HIF-1α-specific shRNAs as determined by GC-MS. B) Lipid biosynthesis in AMPKα-deficient MEFs with HIF-1α knockdown. Control (Cre−) or AMPKα-deficient (Cre+) MEFs expressing control (Ctrl) or HIF-1α-specific shRNAs were incubated with uniformly labeled 14C-glucose for 72 hours, and radioactive counts in extracted lipids were measured. C) Cell size of control (grey histogram), AMPKα-null (open histogram), and AMPKα-null MEFs expressing HIF-1α shRNA (dashed histogram) as measured by FSC intensity. D) Growth curves of AMPKα-null MEFs expressing control (shCtrl) or HIF-1α-specific (shHIF-1α) shRNAs grown under 20% O2. Growth curves were determined using a 3T3 growth protocol and cell counts measured by trypan blue exclusion. ***, p<0.001.
