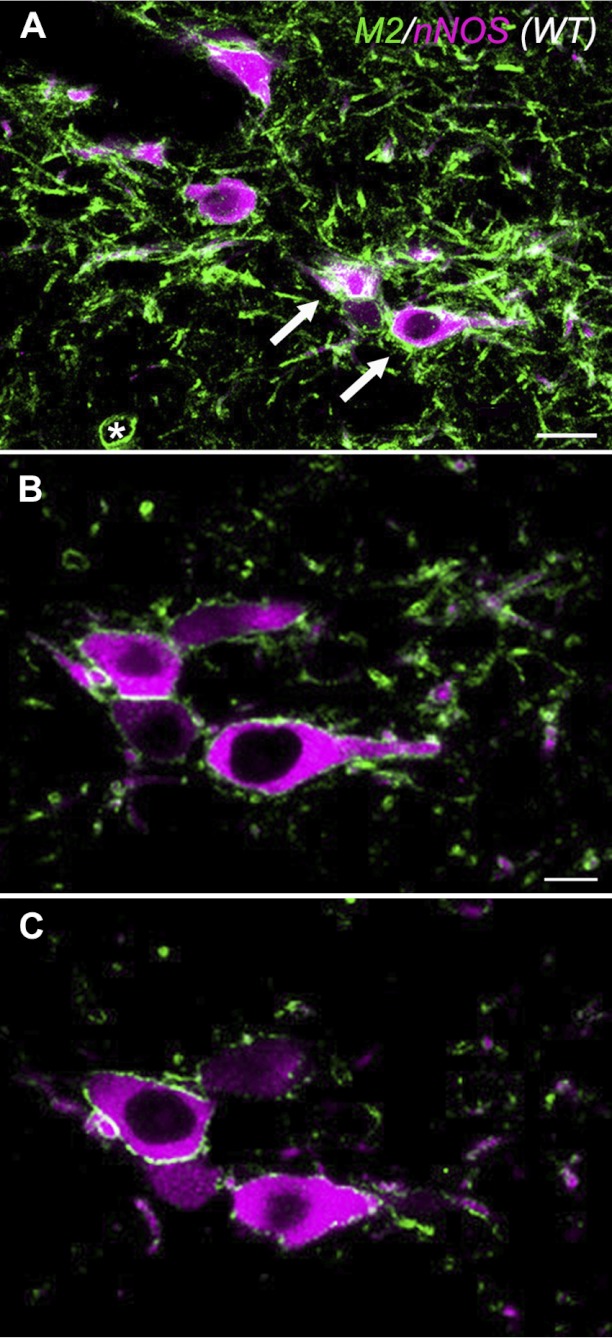
Fig. 2.

Neuronal nitric oxide synthase (nNOS) neurons in the LDT express M2 mAChRs. Confocal images illustrate LDT cells labeled with antibodies against the M2 mAChR (green) and nNOS (purple). A: a merged stack of optical sections. B and C: single 1-μm optical sections within the stack illustrated in A. M2 mAChRs are expressed on the membranes of nNOS+ cells (arrows) and nNOS− cells (asterisk). Scale bar in A = 20 μm. Scale bar in B = 10 μm and also applies to C.
