
Fig. 4.
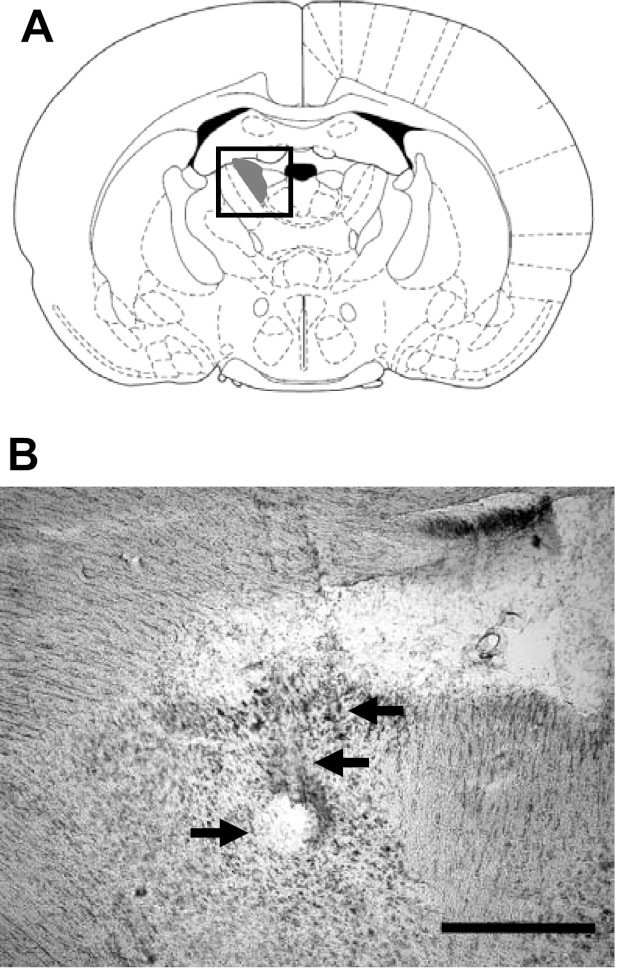
A: plate reproduced with permission from Paxinos and Watson (1998) showing the ADN at −1.4 mm relative to bregma. B: enlarged view of the boxed region in A showing the electrode wire tracks through the ADN (arrows pointing left) and the Prussian blue mark below the ADN (arrow pointing right) in a representative electrolytically lesioned rat (sg1). Scale bar, 500 μm.