
Fig. 6.
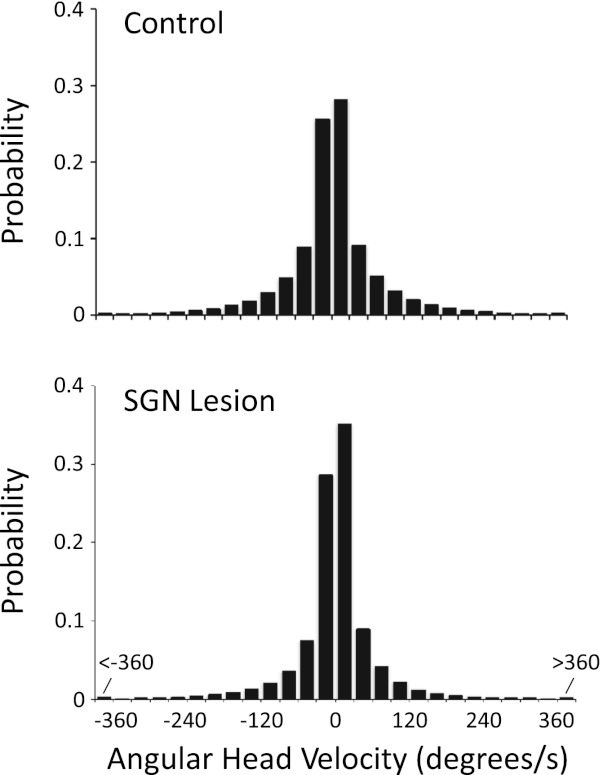
Histograms showing the probability of angular head movements occurring at angular head velocities grouped in 30°/s bins and according to clockwise (CW, +) or counterclockwise (CCW, −) head turns. The distributions are taken from the cells recorded in control (top) and lesioned (bottom) animals during standard sessions. Note the larger values for the 2 bins surrounding 0°/s for the SGN lesion group compared with the control group, indicating that the lesioned animals turned their heads less frequently than the control animals.