
Fig. 1.
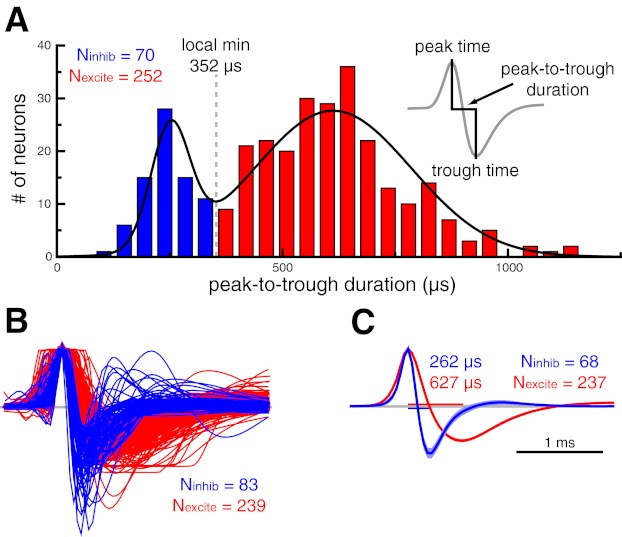
Spike waveform-based classification of inferior temporal cortex neurons as putative inhibitory or putative excitatory. A: histogram of peak-to-trough waveform durations (inset) for the population of inferior temporal cortex neurons. We fit this distribution with a sum of 2 Gaussians (black trace) and used the local minimum (352 μs) as the cutoff for our waveform duration-based classification. Throughout all figures, data pertaining to putative excitatory and putative inhibitory neurons are shown in red and blue, respectively. B: amplitude-normalized waveform vectors sorted by a k-means clustering algorithm. The cluster with shorter waveform durations was deemed putative inhibitory. Timescale is the same as in C. C: average waveform for putative inhibitory and putative excitatory neurons that were consistently classified by the waveform duration-based and k-means clustering algorithms. Median waveform durations are shown for both distributions. Shaded region denotes 95% confidence interval.