Figure 1.

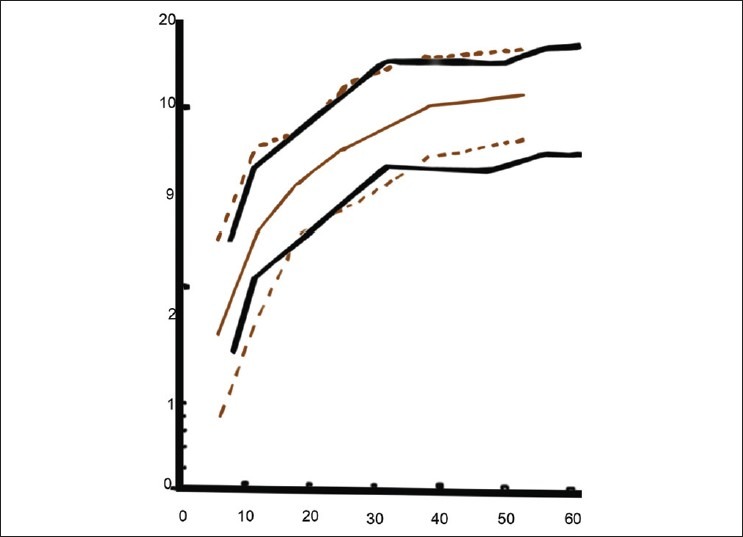
Graph with dark black and bold lines is the normative data of our study. The dotted grey graph is the normative data of Lea's study

Graph with dark black and bold lines is the normative data of our study. The dotted grey graph is the normative data of Lea's study