Fig. 4.

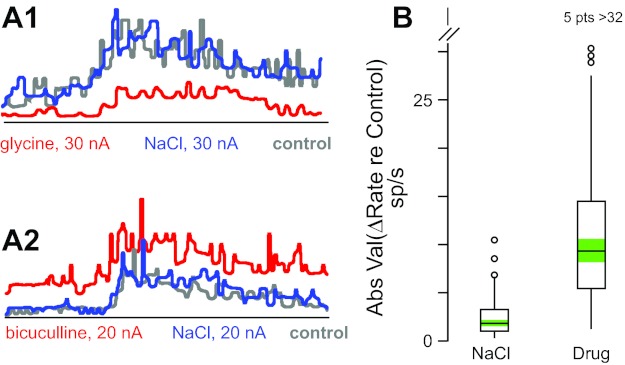
Iontophoresis current does not affect neuron firing rate. A: average peri-event histograms for 2 neurons (A1, A2) in the pre-control period (gray), during iontophoresis of sodium chloride (blue), and during iontophoresis of glycine (A1, red) or bicuculline (A2, red). Traces are aligned on torque onset; data from movements in all directions are combined. B: box plots of effects on firing rate of iontophoresis of sodium chloride (NaCl) and neurotransmitter agonists and antagonists (Drug: glycine, GABA, strychnine, and bicuculline effects combined); ordinate shows absolute value of difference between rate during iontophoresis and control rate [absolute value normalizes effects of agonists (decrease) and antagonists (increase)]; data include all responses (n = 143) during ramp and hold phases for all neurons (n = 65) that were tested with NaCl and had a significant response to at least 1 agonist or antagonist. Box plots show the interquartile range of the data (box), the median (horizontal line), 1.5 times the interquartile range (vertical lines), data points outside this range (circles; 5 data points with change in rate >32 spikes/s not shown for Drug plot), and the 95% confidence intervals around the median for each distribution (green shading). NaCl and Drug distributions are significantly different at the P < 0.001 level (paired t-test).
