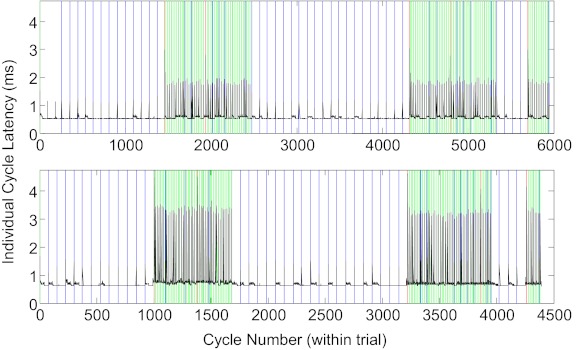
Fig. 5.

Cycle latencies for a typical behavioral tracking epoch on a single example trial using XGL (top) and PTB (bottom) stimulus presentation frameworks. During these example trials, 2 inputs (eye position and button status) are being monitored by the track routine, and movie stimuli are displayed. The black trace indicates individual cycle latencies for all cycles in the trial. The green vertical lines indicate cycles during which the toggle subfunction is called. The blue vertical lines indicate cycles in which the control screen is updated. The red vertical lines indicate cycles in which the control screen is updated and the toggle subfunction is called.
