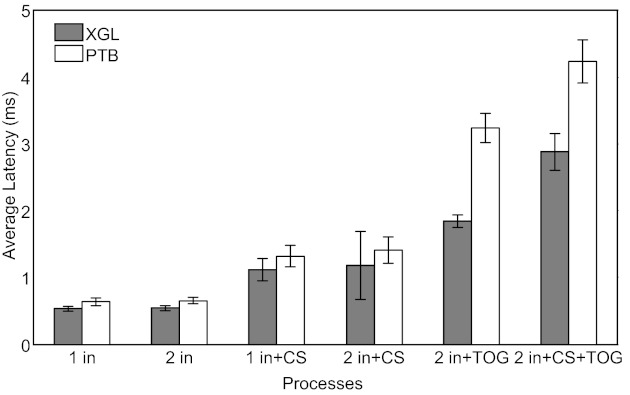
Fig. 6.

Average latency of processes in the track function. The bars show the time required for different combinations of behavioral inputs, and video operations in track using XGL (gray) and PTB (white) stimulus presentation frameworks are shown. Each process consisted of monitoring 1 or 2 inputs (“in”) while track simultaneously performed updates to the experimenter's control screen (“CS”) and toggled movie stimuli on the subject's screen (“TOG”). Error bars represent standard deviation.
