
Fig. 6.
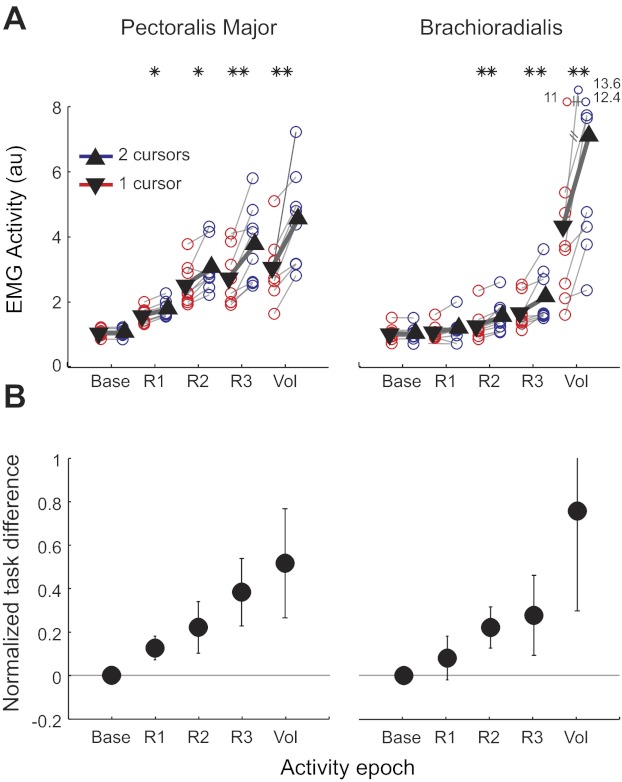
Experiment 1: baseline resampled. Muscular activity after resampling, such that the baseline EMG activity is matched across tasks. A: mean EMG activity in different time epochs (*P < 0.05, **P < 0.01). B: normalized EMG difference across tasks [(double-cursor − single-cursor)/single-cursor] in matched baseline trials. Right and left PM and Br muscle activities are pooled for this analysis. Error bars indicate SE across participants.