
Fig. 7.
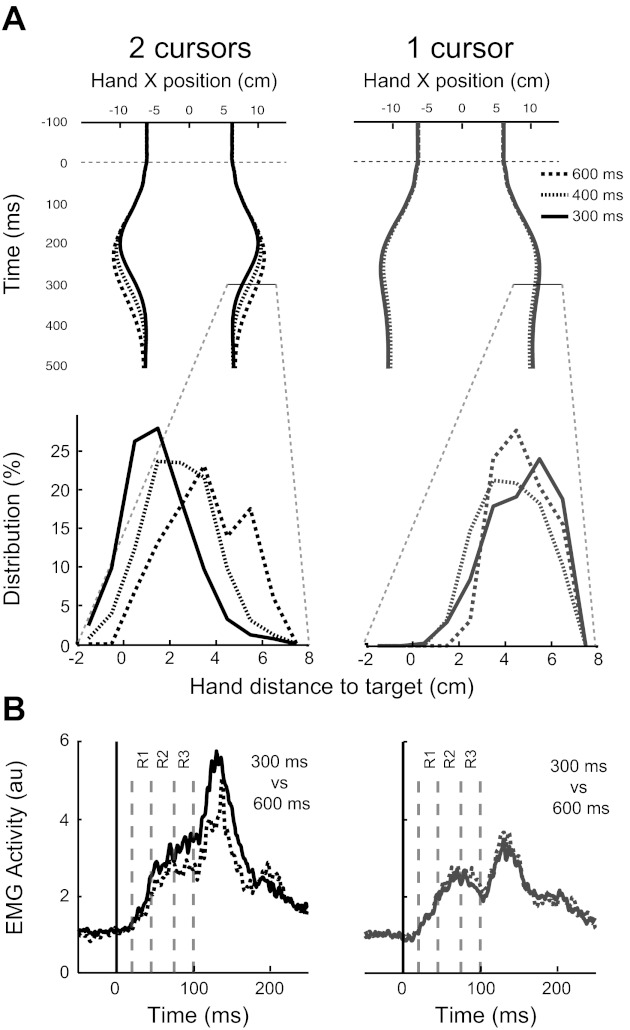
Experiment 1: effect of time limit. A, top row: mean horizontal hand position for each time limit and for all participants (black: double-cursor condition; grey: single-cursor condition). A, bottom row: Hand-position distributions 300 ms following perturbation onset for each time limit. While the distributions show a shift toward the target for the shortest time limit in the double-cursor task, the distributions do not shift for different time limits in the single-cursor task. B: PM EMG for the 300- and 600-ms time limits [or double (right)- and single-cursor (left) tasks].