
Fig. 9.
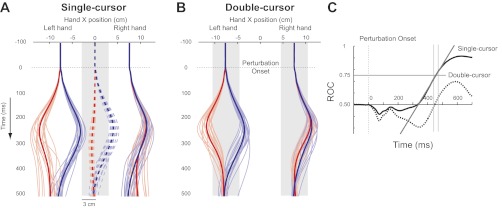
Experiment 2: kinematic results. A: mean horizontal hand paths and cursor positions across all participants in the single-cursor task (red: mirror-perturbation; blue: matching-perturbation. Thin line: single participant; thick line: Mean of all participants). Shaded boxes demonstrate the acceptable target area for each task. B: mean horizontal hand paths across all participants in the double-cursor task. C: mean ROC curves across different conditions (solid: single-cursor; dashed: double-cursor). In the single-cursor task, a line (solid gray) is fitted to a 30 ms period of ROC curve around the time it passes the threshold (0.75, thin vertical grey lines depict the regression margins), and its interception with baseline (0.5) is determined as the time when behavior deviates across tasks. Double-cursor ROC fails to pass the threshold.