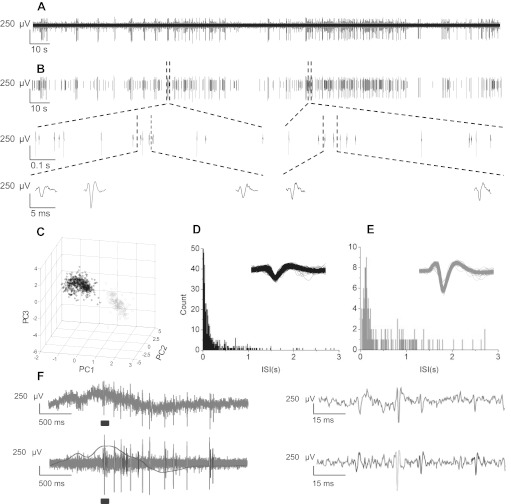
Fig. 2.

Resolution of single unit activity via spike sorting. A: example of high pass-filtered multiunit activity recorded in CA3. B: single unit activity resolved via spike sorting with principal component analysis. Two distinct cells are indicated (in black and gray). Two portions of the trace are expanded to show waveforms on 1-s and 50-ms timescales. C: waveforms from the two cells plotted according to the first three principal components of the waveform (PC1–PC3). D and E: frequency distributions of interspike intervals (ISIs) from example sorted cells shown in B. Inset, overlay of all detected waveforms. F, left: raw data trace (top) and high pass-filtered spike-sorted action potentials (APs) with low pass-filtered field potential overlayed (bottom). Right, expanded view of times over bars displaying single APs and how they are sorted. The example shows AP traces during LFP containing no refractory period infractions or collisions between spikes from cells 1 and 2.
